The qualification level, unit, series, tier (if applicable) and number of candidates being viewed can be seen above the report details. The UMS centre and national averages as well as the maximum marks available per topic are also displayed numerically.
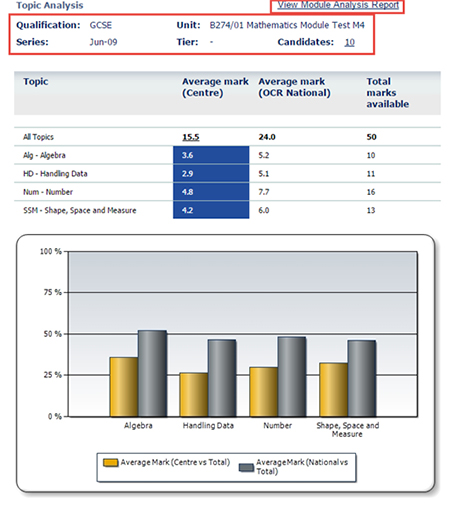
This report is provided for GCSE maths only. It provides a breakdown of a unit (paper) into topics, showing average raw marks for the whole cohort for a topic.
- Using raw marks this gives the average mark (centre) per topic for the whole cohort.
- For comparison the national average is shown under average mark (OCR national).
- Using the filters, this can be changed to show similar centres.
- Significance is shown where applicable with green indicating significantly higher than average and blue indicating significantly lower than average.
- The graph compares the centre average performance with the national average.
- The link on average mark (centre) figure for all topics takes you to the question level analysis report.
- The link on the number of candidates takes you to the candidate unit report.
- A link to the module analysis report.